ENRICHED DATA & VISUALISATION
Data Analytics always starts with data enrichment and appropriate visualization of your data. This gives you immediate insight into the extra value that can be generated from your data. With these insights you can make better decisions for further research or improvement actions.
Approach
We collect data from various internal sources and build up a enriched dataset. This is often supplemented with external, structured and / or unstructured data. Based on our expertise, we design an appropriate data model, we also develop and build interactive visualizations (dashboards and reports). Because every organization is unique, the visualizations are usually custom-made.
Result
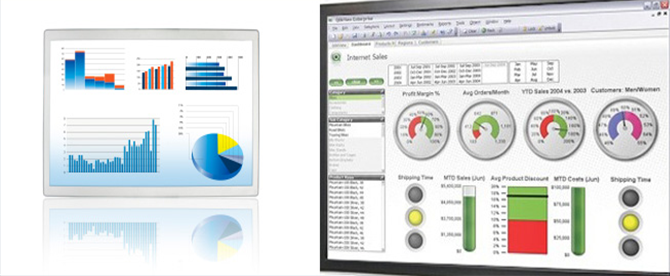
Dashboard and reports that allow you to create cross-sections of your data quickly and interactively. The underlying data can directly be examined in an interactive and associative way. The results of our work are therefore a) adequate data model, b) enriched data set and c) interactive visualization application.